Build and Scale Faster
150+ products shipped for startups and enterprises by engineers focused on real outcomes.
"Their ability to quickly understand an unfamiliar use case and respond creatively to it is impressive."

Anonymous
Executive, Pured Disc Golf

"TechnBrains resolved challenges efficiently and turned my vision into a solid, functional product with a strong foundation."

Jalen Gibbs
Founder, STREAMLINE LIVE
"The talent they provided was solid, but more importantly, they were quick to align with our way of working."

Nancy Snyder
Managing Director, MimeCast
Our trusted clients


Start Your Product Journey Today
Turn your idea into a working product. Share a few details and we'll help define the roadmap, timeline, and execution approach.
App Monetization Strategies in 2026: Every Model, With Real Numbers
There are six app monetization strategies: in-app purchases, subscriptions and freemium, in-app advertising, marketplace commission, sponsorship and affiliate, and paid download. Match the model to how often the app is used and what each active user costs you to serve.

Updated Aug 13, 2026
Across 115,000+ subscription apps, the median app grew recurring revenue 5.3% last year. The top 10% grew 306%. The bottom quartile lost a third (RevenueCat, 2026).
App monetization strategies are no secret and every team can use all of them, so the model is not what separates those outcomes. What separates them is whether the model matches how the product is used, and whether the payment layer underneath it works. Your app sits somewhere in that spread, and this article is about which end. If you are still scoping the build, start with what app costs to build.
TL;DR: App Monetization Strategies in 2026
- Top 6 app monetization strategies: in-app purchases, subscriptions and freemium, advertising, marketplace commission, sponsorship and affiliate, and paid download. Most profitable apps run two.
- Sensor Tower puts global in-app purchase revenue at $167 billion for 2025, up 10.6%, with non-gaming apps out-earning games for the first time. Business of Apps puts mobile ad spend at $419 billion over the same period. Ads are the bigger market and pay less per user.
- Across 115,000 subscription apps, RevenueCat records hard paywalls converting about five times better than freemium: a 10.7% median Day 35 rate against 2.1%, and $3.09 revenue per install at day 60 against $0.38.
- Store fees moved in 2026. Google Play now charges 10% on your first $1M and on all auto-renewing subscriptions, plus 5% for billing in the US, UK, and EEA. Apple charges 30%, or 15% under the Small Business Program.
- The rule: match the model to usage frequency and marginal cost per active user.
What is app monetization?
App monetization is how an app converts usage into revenue: charging the user directly, charging a third party for access to the user’s attention, or taking a cut of a transaction the app enables.
What are the 6 core mobile app monetization models?
There are six ways to monetize apps: in-app purchases, subscriptions and freemium, in-app advertising, marketplace commission, sponsorship and affiliate, and paid download.
They differ less in how much money exists in each and more in what must be true about your product. The right column gives examples in production.
| Model | Build complexity | Best fit | Real example |
| In-app purchases | Low to medium | Utilities, tools, games with virtual goods | Candy Crush Saga (consumables) |
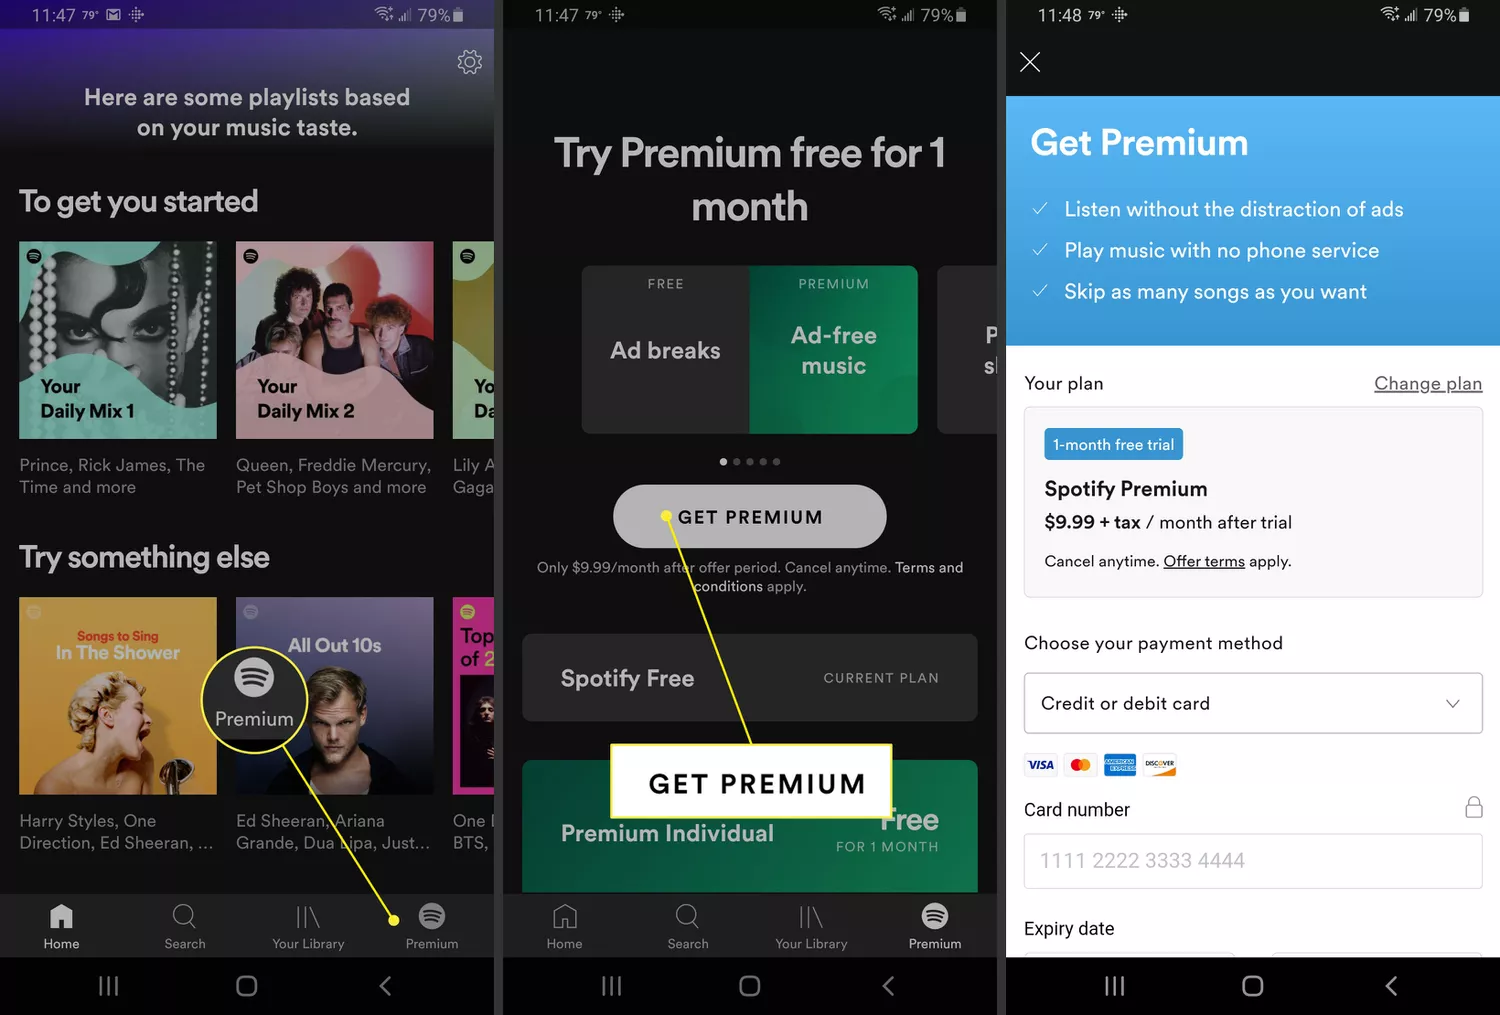
| Subscriptions and freemium | Medium to high | Habitual use, content, productivity, B2B | Spotify (free tier plus Premium) |
| In-app advertising | Low to medium | High-DAU free apps, casual games, feeds | Duolingo (ads on the free tier) |
| Marketplace commission | High | On-demand services, delivery, bookings | DoorDash, Uber Eats |
| Sponsorship and affiliate | Low | Niche audiences, content, finance apps | Rakuten (affiliate cashback) |
| Paid download | Lowest | Professional tools with an established buyer | Procreate (one-time) |
For context on how these get combined in practice: RevenueCat’s 2026 dataset finds 63.5% of subscription apps run subscriptions alone, 23.2% pair them with a lifetime option, and 10.7% add consumables. Single-model is still the norm; the hybrid stacking discussed later is the exception that scales.
Two of those rows hide sub-types that change what you have to build. In-app purchases and subscriptions each split in two, and the split decides how much engineering the model costs you.
In-app purchases: consumables and non-consumables
Consumables are used up and expire, like an extra life or a pack of AI credits. Non-consumables are permanent, and both stores tie them to the buyer’s account so they restore on reinstall.
Google Play restores them automatically; on iOS the user has to trigger it, which is why a missing restore button generates support tickets on day one. Consumables often cannot be restored at all, so that balance has to live on your server.

Subscriptions: auto-renewable and prepaid
Auto-renewable is the default and the one every benchmark in this article measures. Prepaid, which Apple calls non-renewing, bills once for a fixed period and stops.
Prepaid suits seasonal products and course-based content where auto-renewal reads as a trap. It also removes the dunning and grace-period work that auto-renewal forces on you, which is the main reason it costs less to build.
Paymium: paid download plus in-app add-ons
Pay to download, then pay again inside for add-ons. It is rare, and it works only where the buyer already accepts paid software, mostly professional creative and productivity tools.
The risk is that you ask the same person to clear two purchase decisions. Where it works, the download price acts as qualification rather than as the main revenue line.
Freemium: an access model, not a revenue model
Freemium decides who sees the paywall, not how you get paid. It sits on top of a subscription or an in-app purchase rather than replacing either.
Treating it as a revenue model in its own right is the most common taxonomy error in monetization writing, and it matters because it hides the actual decision: what the free tier costs you to serve.
What this list leaves out, and why
Five methods that appear in most monetization roundups are excluded here on purpose: data licensing, donations, crowdfunding, physical goods, and passive SDK monetization.
Crowdfunding funds a build rather than monetizing one. Donations rarely scale past a niche. Data licensing and passive SDK monetization both carry store-policy and privacy exposure that outweighs the revenue for a commercial product, and apps have been removed from both stores for each.
How to monetize an app, step by step
Decide the access model before designing the paywall, price against realized lifetime value rather than competitors, build entitlement server-side, then instrument and change one variable at a time.
- Establish usage frequency and marginal cost per active user. A daily-use app with real per-user infrastructure cost is a subscription business. An app opened twice a year with near-zero marginal cost is not.
- Choose the access model, not the price. Hard paywall, freemium, or free with ads is the structural decision. Price is tuned afterwards.
- Price against realized LTV per payer. Competitor pricing tells you what the market anchored on, not your retention curve or fee tier.
- Build entitlement server-side. Receipt validation on your backend, an entitlement record the client reads rather than computes, restore handling, renewal and refund webhooks, grace periods.
- Decide the payment route per SKU. Store billing, alternative billing, and web checkout net different amounts by price point and platform.
- Instrument, then experiment. Track download-to-trial, trial-to-paid, and retention by platform. Two simultaneous paywall changes give one uninterpretable result. Adapty reports that apps running experiments earn 40 times more than those that do not.

Production Reality
Client-side purchase state is the most common defect we find in monetization code that shipped fast. It survives the happy path, then fails the first time someone reinstalls, switches devices, or has a card decline mid-renewal. It belongs in the mobile app development scope, not a post-launch phase.
Which monetization model fits which app type?
Habitual-use consumer apps and B2B tools belong on subscriptions, infrequent-use utilities on one-time unlocks or credits, high-volume free apps on ads, and anything intermediating a transaction on commission.
| App type | Primary model | Practical secondary | What breaks it |
| B2C habitual use | Subscription with trial | Annual plan plus lifetime unlock | Weak day-0 value proof |
| B2C infrequent-use utility | One-time unlock or credits | Optional cheap subscription | Charging monthly for a twice-a-year job |
| B2B SaaS and internal tools | Seat or usage-based subscription | Onboarding or integration fees | Consumer-style paywalls on a buying committee |
| Games | Consumable purchases | Rewarded video | Interstitials at the wrong point in a session |
| Marketplaces and on-demand | Transaction commission | Merchant subscriptions, promoted placement | A take rate set before unit economics |
| AI-native apps | Usage-based or tiered subscription | Credit packs for spiky use | Pricing that ignores inference cost per user |
The marketplace row is the one teams underestimate. Published take rates cluster between 15% and 30%: DoorDash lists 15%, 25%, and 30% delivery tiers, and Uber Eats raised its entry tier to 20% in March 2026. Those numbers exist because each platform absorbed years of cost discovery first.
On a multi-role property services platform we built, spanning owners, managers, vendors, and residents across 685,000+ users, the question was never the percentage. It was which of the four roles should pay. That question sits under any marketplace platform or multi-role SaaS product.
Subscription or one-time purchase: when should you choose each?
Subscribe when value recurs and you carry a real per-user cost. Charge once when the job finishes once. Sell credits when usage is spiky.
Subscriptions have better benchmarks, and better benchmarks do not make them right for your app. RevenueCat’s retention data points at why: plans survive when the billing cycle matches how often the user experiences value.
Year one retention runs 20% to 40% on annual plans, 6% to 14% on monthly, and 1% to 2% on weekly. A tool opened twice a year has no billing cycle that matches, which is why an infrequent-use utility on a monthly plan produces refund requests rather than a clean churn number.
Scale your expectations before choosing. Adapty’s 2026 benchmark study, covering 16,000 apps and $3 billion in subscription revenue, puts the median subscription app at $492 a month, with the top 10% taking 94.5% of all subscription revenue. A subscription is not a model that works by default. It is one that works very well for a small number of products.
The five workable options:
- One-time unlock. Simplest to build and to explain, and it funds development once. Suits utilities and professional tools with a defined job. The ceiling is fixed: you are paid once per customer, so growth has to come from new buyers rather than from the base you already have.
- Consumption credits. The user pays for what they use, sold as a consumable purchase. It remains a minority structure: RevenueCat records 7% of apps pairing subscriptions with consumables overall, rising to 27.5% in gaming. It fits bursty usage and any feature with a real per-action cost, and it removes the fairness objection, because nobody is billed in a month they never opened the app.
- Subscription with a trial. Highest ceiling, most operating work. RevenueCat records trials of 17 to 32 days converting at a 5% median against 25.5% for trials of four days or less, while the share of apps using the shortest trials rose to 46.5%. Teams are shortening trials for cash flow and experiment velocity, against their own conversion data.
- Subscription plus a lifetime unlock. More common than it looks: RevenueCat records 2% of apps pairing a subscription with a lifetime option, rising to 33% in Photo and Video. It gives the subscription-averse user somewhere to go instead of leaving a bad review. Price it against realized LTV, not as a round multiple of the annual plan.
- Version-based upgrade pricing. Works on desktop, awkward on mobile. Each paid version becomes a new store product, a new review cycle, and a legacy tier you support indefinitely. No major dataset tracks it, because few mobile apps run it.
Should you combine monetization models?
Usually yes, but stack in sequence rather than at launch, because every additional stream brings its own billing, consent, and measurement work.
AppsFlyer’s State of App Monetization 2026, built on $900 million in in-app purchase revenue, $800 million in subscription revenue, and $7.2 billion in ad revenue between January 2025 and March 2026, shows where the momentum sits. Subscription revenue grew 105% year over year in Q1 2026, against 29% for store in-app purchases and 14% for ad revenue, and 71% of subscription-monetizing accounts grew year over year.
AppsFlyer’s category data argues against stacking for its own sake. In games, midcore titles run 90% in-app-purchase only and hypercasual runs 79% ad only. Casual is the diversified category, splitting 47% purchases, 28% ads, and 21% hybrid. Hybrid wins where a format really has two audiences, not everywhere.
A workable sequence: start with the model your category indexes on, add a second once the free tier has the volume to justify the engineering, and only then consider a third.
Behind the number: the measurement trap catches more teams than the engineering does. AppsFlyer found ad-monetized apps recover nearly 90% of their day 60 revenue by day 7, while subscriptions reach only 52%. Run both and judge them on the same LTV window and you will systematically underrate the subscription and over-invest in ads. Set a different measurement window per stream before you switch the second one on.
How do you monetize an AI app?
Usage credits or a tiered subscription, priced against inference cost per active user, and built on the assumption that retention will be worse than a comparable non-AI app.
AI is the fastest-moving category in app monetization right now. Sensor Tower’s State of AI 2026 puts in-app purchase revenue from AI apps on track to pass $4 billion in the first half of 2026, up 36% half over half, with time spent more than doubling from 17.2 billion hours in H1 2025 to a projected 36 billion.
More than 200,000 apps now mention AI in their store descriptions, and the ramp can be steep at the individual app level. Sensor Tower records Claude’s US mobile revenue per user rising from under $0.50 in September 2025 to $2.76 by May 2026.
Three structures work, and they differ mainly in who absorbs the cost of a heavy user.
Tiered subscription
Use it when AI improves a job your app already did, and only with usage caps enforced in the entitlement layer. Core features stay free and AI features sit behind a paid tier. It is the simplest structure to build and the easiest to explain, and it suits products where AI improves a job the app already did rather than being the whole product.
The risk is margin. Your price is flat and your cost is not, so a small group of heavy users can consume more inference than they pay for. Fair-use caps and per-tier limits are what keep this solvent, and they have to live in the entitlement layer rather than only in terms of service.
RevenueCat’s 2026 report describes the direction of travel: AI apps are running less generous free tiers, shortening trials, and adding higher-priced tiers specifically to cover inference cost.
Usage credits
Use it when inference is expensive or demand is spiky, because it is the only structure where revenue tracks cost. The user buys a balance and each generation draws it down. This is the only structure where revenue tracks cost directly, which makes it the right default when inference is expensive or demand is spiky.
Three decisions come with it. Whether credits expire, which changes both how you recognise revenue and how buyers feel about topping up. Where the balance is held, which has to be your server rather than the client, for the same reason entitlement does. And what a credit is worth, which needs margin over your per-generation cost plus headroom for model pricing you do not control.
The tradeoff is friction. A user who can see the meter running uses the product less, so pricing a credit too tightly suppresses the engagement you need for retention.
Hybrid: subscription plus top-ups
Use it once you have both casual and heavy users, and budget for metering two balances instead of one. A subscription with an included allowance, plus paid top-ups once it runs out. Most AI apps land here, because it gives predictable base revenue while still capturing the users who would otherwise blow through a flat tier.
It is also the most work. You are metering two balances, reconciling them at renewal, handling what happens when an allowance resets mid-cycle, and explaining all of it on a single paywall screen. Budget for it accordingly.
The pricing question is not what competitors charge. It is your marginal app development cost per active user, which for AI is real and variable in a way it is not for almost any other category.

Founder risk: RevenueCat’s dataset finds AI-powered apps generating 41% more revenue per payer while churning 30% faster. That combination buys a strong first year and a weak second one. Price for the cohort you keep rather than the cohort you acquire, and treat any retention forecast borrowed from a non-AI benchmark as optimistic.
Users are growing, revenue is not
That usually means the model does not fit the usage pattern. We map your retention curve and marginal cost per user against all six models, then tell you which one your product can carry and what changing costs.
What are the real app monetization benchmarks for 2026?
Sensor Tower’s State of Mobile 2026 records downloads flat in 2025 at around 149 billion against in-app spending up 10.6%, which places growth in monetization rather than acquisition.
| Benchmark | Figure | Source |
| eCPM by format (2024 global) | Banner ~$2.80, interstitial ~$4.80, rewarded ~$10.50 | Business of Apps |
| Day 35 download-to-paid | 10.7% hard paywall vs 2.1% freemium | RevenueCat |
| Revenue per install, day 60 | $3.09 hard paywall vs $0.38 freemium | RevenueCat |
| Median Year 1 LTV per payer | $32 North America, $23 global | RevenueCat |
| Trial-to-paid by trial length | 42.5% at 17-32 days vs 25.5% under 4 days | RevenueCat |
| AI apps | 41% more revenue per payer, churn 30% faster | RevenueCat |
Our Read: RevenueCat’s cancellation data shows 55.4% of three-day trial cancellations landing on day 0, which makes the trial a first-session test and onboarding the real paywall. The AI premium also carries a churn penalty, so AI features buy trial revenue, not a business.
Before assuming ads are easier: 20,000 daily active users at 1.5 rewarded impressions each and a $10.50 eCPM is roughly $9,400 a month. That is arithmetic on published averages, not a forecast.
What is a real-world app monetization example?
Spotify is the clearest public example, because it runs a free ad-supported tier and a paid subscription side by side and reports each segment separately in its quarterly results.
Spotify’s Q2 2026 shareholder update, filed 4 August 2026, shows 300M Premium subscribers against 494M ad-supported users. The subscribers produced EUR 4.33B that quarter. The larger free tier produced EUR 446M. A paying subscriber was worth roughly 16 times an ad-supported one, from a base 61% as large. Ads funded discovery and fed the paid tier.
How much of your app revenue do the stores keep in 2026?
Apple takes 30%, or 15% under the Small Business Program and on second-year subscriptions, and currently nothing on US external purchase links. Google Play charges 10% on your first $1M and on all auto-renewing subscriptions, plus 5% for billing.
| Platform | Rate | Applies to |
| Apple, standard | 30% | In-app purchases, first-year subscriptions |
| Apple, reduced | 15% | Small Business Program (under $1M prior-year proceeds), or subscribers past 12 months |
| Apple, US external links | 0% currently | US link-outs, pending a court-set rate |
| Google Play, service fee | 10% | First $1M annual earnings, and all auto-renewing subscriptions |
| Google Play, billing fee | 5% | US, UK, EEA transactions using Play billing only |
| Google Play, above $1M | 20% new installs, 25% existing | Non-subscription purchases; 15% in Apps Experience or Games Level Up |
Google’s change took effect on 30 June 2026 in the US, EEA, and UK, with reduced rate cards from 30 September 2026. This is what makes web-checkout funnels viable: acquire on the web, take payment there, deep-link in.
Apple’s zero-commission position on US link-outs comes from the Epic v. Apple contempt proceedings, not Apple’s pricing, and it is unsettled. The Ninth Circuit vacated the blanket ban in December 2025 and remanded for a cost-tied rate. The Supreme Court granted certiorari on 30 June 2026.
At 30%, external billing looks like an obvious win. In our experience it often is not. Route payment yourself and you inherit processing fees, tax registration, refunds, chargebacks, and dunning. Those costs can exceed the store fee on a $9.99 monthly plan. On a $99.99 annual plan the arithmetic flips.
Model it per SKU, and keep the route behind a server-side flag so the choice stays reversible.
How does iOS app monetization differ from Android?
The fee structures have diverged, Android loses far more revenue to billing failures, and new subscription supply is concentrating heavily on iOS.
Three differences matter for iPhone app monetization against Android. First, fees: Apple’s 30% or 15% is a single commission, while Google Play splits a 10% service fee from a 5% billing fee, so the same $9.99 subscription nets differently on each platform.
Second, involuntary churn. RevenueCat’s 2026 dataset records 31% of Google Play subscription cancellations as involuntary billing failures rather than product rejection, against 14% on the App Store, with the Play figure worsening from 28.2% a year earlier (RevenueCat, 2026).
Android app monetization strategies therefore need retry logic and grace periods, one of the few places engineering recovers revenue with no acquisition spend attached. Fix dunning before the paywall.
Third, supply. Appfigures data published within RevenueCat’s 2026 report puts iOS at roughly 77% of new subscription app launches, up from about 67% in 2023, a shift the report attributes partly to AI-assisted development tools defaulting to App Store first.
How much does it cost to build app monetization?
Roughly $4,000 to $12,000 for a one-time unlock, $12,000 to $35,000 for a subscription stack with trials and server-side entitlement, and $40,000 upward for marketplace payments. These are TechnBrains estimates at 2026 US blended rates, excluding the app itself.
| Monetization layer | Effort | Indicative cost (TechnBrains estimate) | What drives it up |
| One-time unlock (non-consumable IAP) | 1 to 2 weeks | $4,000 to $12,000 | Restore purchases, multi-device entitlement |
| Consumable credits with metering | 2 to 4 weeks | $10,000 to $25,000 | Balance ledger, refund and abuse handling |
| Subscription stack with trials | 3 to 6 weeks | $12,000 to $35,000 | Entitlement service, webhooks, dunning, win-back |
| Marketplace payments and payouts | 6 weeks+ | $40,000+ | KYC, escrow, split payments, per-market tax reporting |
Two costs get missed. The base product is the larger number, covered in the app development cost breakdown.
The monetization layer also costs money to keep running, because store policy changes, SDK deprecations, and receipt-format updates arrive on someone else’s schedule. It belongs in the ongoing maintenance cost budget.
Not sure which app monetization strategies fit your product?
We review your paywall timing, entitlement layer, and payment routing against your live app, then return a ranked list of fixes with the cost of each.
Request a monetization reviewTable of Contents
Frequently Asked Questions
There is no single best app monetization strategy. Match it to usage frequency and marginal cost per user: frequent use with real per-user cost points to a subscription, infrequent use to one-time unlocks or credits, high free volume to advertising, and transactions to commission.
By total market, advertising is largest at $419 billion in 2025 against $167 billion in in-app purchases. By revenue per user, subscriptions win decisively. Non-gaming apps overtook games for the first time in 2025, led by AI and productivity.
Users are not the unit buyers price on. Acquirers value trailing revenue and profit, so 100,000 users on a subscription app and 100,000 on an ad-supported one differ by an order of magnitude. Work out revenue per user first, then discuss multiples.
Four stand out in the 2026 data: weekly billing overtaking monthly and annual combined at 55.5% of subscription revenue, hard paywalls replacing freemium as the default, store fees unbundling into separate service and billing components, and AI features driving higher revenue per user alongside worse retention.
No. If users open the app infrequently, a one-time unlock or credit pack usually earns more than a subscription that generates refunds and one-star reviews. Consumable in-app purchases are supported on both stores.
In the US, yes on both platforms. Apple currently takes no commission on US external purchase links, though a court is due to set a rate, and Google begins charging fees on link-outs from 1 October 2026. Whether it nets more depends on your price point.
About 2.6% of North American downloads convert to paid by day 35, and the median Year 1 realized LTV per payer is $32. That is roughly 26 payers and around $830 in first-year gross revenue, before store fees. An ad-supported app at that scale typically earns under $50 a month.
Blocked by backlog or missing expertise?
Senior developers who build, fix, and ship — without slowing your team down.