Build and Scale Faster
150+ products shipped for startups and enterprises by engineers focused on real outcomes.
"Their ability to quickly understand an unfamiliar use case and respond creatively to it is impressive."

Anonymous
Executive, Pured Disc Golf

"TechnBrains resolved challenges efficiently and turned my vision into a solid, functional product with a strong foundation."

Jalen Gibbs
Founder, STREAMLINE LIVE
"The talent they provided was solid, but more importantly, they were quick to align with our way of working."

Nancy Snyder
Managing Director, MimeCast
Our trusted clients


Start Your Product Journey Today
Turn your idea into a working product. Share a few details and we'll help define the roadmap, timeline, and execution approach.
AI Software Development Statistics 2026: Adoption, Productivity & Code Quality
AI adoption is now mainstream in software development, but the outcomes are mixed. TechnBrains' review of 30 research programs found productivity ranging from 19% slower task completion to 26.08% more completed work, while review, security and delivery remain the biggest gaps.

Updated Aug 13, 2026
AI code assistants are expected to become a $10.3 billion market in 2026, while 90% of professional developers already use AI at work. But more AI use has not produced an equally clear improvement in productivity, code quality, security or custom software delivery.
TechnBrains reviewed 30 primary and near-primary research programs covering randomized experiments, developer surveys, engineering telemetry, longitudinal studies, and platform data to determine where AI is actually improving software development and where the evidence breaks down.
The findings show that adoption is no longer the useful question. The important gaps now sit between AI use and trust, code generation and verification, individual productivity and software delivery, and agent adoption and measurement.
AI Software Development Statistics: Key Takeaways
Adoption
- 90% of professional developers regularly use AI at work; 74% use specialist developer AI tools rather than chatbots. ·
- 84% use or plan to use AI; 51% of professionals use it daily.
- ~80% of new GitHub developers use Copilot within their first week. Platform telemetry, new-signup cohort ·
Productivity
- AI access increased completed tasks by 26.08%.
- Experienced maintainers took 19% longer with early-2025 AI while believing they were 20% faster.
- Developers report saving 3.9 hours per week.
Code Generation and Delivery
- AI-authored merged code rose from 22% to 27.4% between Q4 2025 and Q1 2026.
- AI-assisted pull requests were 2.6x larger (408 lines vs 157) and waited 4.6x longer for review.
- AI-generated PRs were accepted at 32.7%, versus 84.4% for manual PRs.
Trust and Verification
- Only 4% completely trusted AI-generated code to be functionally correct; 54% disagreed that it was.
- Only 48% always verify AI code before committing.
- 46% distrust AI accuracy, versus 33% who trust it.
Security and Code Quality
- 45% of controlled AI coding tasks introduced an OWASP Top 10 vulnerability, across 100+ models with no security-specific prompting.
- Syntax pass rates rose from roughly 50% to 95% between 2023 and 2026 while security pass rates stayed at 45-55%.
- Refactoring line moves are down 70% and cross-file reuse down 35%.
The TechnBrains AI Engineering Evidence Framework, 2026
Across 30 primary and near-primary research programs, TechnBrains identified four recurring gaps: adoption vs trust, generation vs verification, individual speed vs delivery, and agents vs measurement.

| Gap | What the evidence shows |
| Adoption to trust | Use is near-universal; confidence in the output is lower and falling |
| Generation to verification | Generation has outpaced review, validation and integration capacity |
| Individual speed to delivery | Task-level gains do not reliably become delivery gains |
| Agents to measurement | Agentic work outpaces methods built around elapsed time |
Two statistics can both be correct and point in opposite directions, because they sit on different sides of one gap.
What Are TechnBrains’ Key Derived AI Software Development Findings?
TechnBrains’ cross-source calculations found a 23-point adoption spread, a 16-point specialist-tool gap, a 51.7-point PR acceptance gap, and a 5.4-point quarterly rise in AI-authored merged code.
These are TechnBrains calculations from published datasets, not original survey data.
| Derived figure | From | What it shows |
| 23-point adoption spread | 74% (JetBrains, specialist tools) to 97% (HackerRank, any assistant) | Adoption figures differ by population and question, not by disagreement |
| 16-point tool-depth gap | 90% against 74%, same JetBrains survey | Broad AI use runs ahead of development-specific tooling |
| 51.7-point PR acceptance gap | 84.4% against 32.7%, LinearB | Generation volume does not convert to merged output |
| 5.4-point quarterly rise | 22% to 27.4%, DX Q4 2025 to Q1 2026 | AI-authored merged code climbs slowly, not in steps |
What Percentage of Software Developers Use AI in 2026?
90% of professional developers regularly used AI at work, while 74% used specialist developer AI tools. Across the major studies reviewed by TechnBrains, reported adoption ranges from 74% to 97% because each study measures a different behavior or population.
The 97% HackerRank figure covers any AI assistant, Stack Overflow’s 84% includes people who only plan to use AI, and GitHub’s ~80% applies only to new developers using Copilot in their first week.
Why Do AI Developer Adoption Statistics Range From 74% to 97%?
TechnBrains found a 23-point spread across major AI developer adoption figures, driven mostly by different definitions and survey populations.
HackerRank’s 97% counts any AI assistant, Stack Overflow’s 84% includes planned use, while JetBrains’ 74% measures specialist developer AI tools. For development-specific adoption, JetBrains’ figure is the most relevant.
January 2026 tool use: Copilot 29%, Cursor 18%, Claude Code 18%, ChatGPT for coding 28%, Antigravity 6%, Codex 3%. These are multi-select reach figures, not market share.
What Percentage of Code Is AI-Generated in 2026?
TechnBrains’ review puts current estimates at 27.4% of merged code and 42% of committed code, depending on where AI authorship is measured in the development pipeline.
For delivery analysis, the 27.4% merge-stage figure is the more conservative benchmark because it comes after more opportunity for rewriting and rejection, although it remains self-reported.
| Figure | Source | What it measures |
| 22%, then 27.4% | DX, Q4 2025 and Q1 2026 | AI code merged without major human rewrites; self-reported, n=34,491 |
| 29% | HackerRank 2025 | Developers’ own estimate of their AI share |
| 42% | Sonar 2026 | Share of committed code called AI-generated or assisted |
| 65% | Sonar 2026 | A respondent forecast for 2027, not an observation |
Generated, accepted, committed and merged code represent different stages of the development pipeline. Merge-stage measures are stricter because AI-generated code can be rewritten or rejected before it reaches merge.
DX’s 22% is self-reported, not telemetry, though it is routinely presented as telemetry set against adoption claims. DX’s adoption figure above 90% is telemetry, across 85,350 developers; the code-share figure is not. Heavy users are barely ahead: 24% for daily users against just over 20% for monthly.
How Much Does AI Improve Software Developers’ Productivity?
TechnBrains’ review of randomized studies found measured AI productivity effects ranging from a 19% slowdown to a 26.08% increase in completed work. Microsoft Research found AI access increased completed tasks by 26.08% across 4,867 developers, while METR found 16 experienced maintainers took 19% longer on 246 real repository issues.
Both studies were randomized but measured different developers, tasks and codebases. Microsoft found larger gains among less-experienced developers, while METR studied experienced maintainers working in repositories they already knew well.
Our analysis suggests developer experience, codebase familiarity, task type and the productivity metric itself explain much of the difference.
How Should AI Developer Productivity Be Measured?
TechnBrains separates AI productivity into five levels: perception, controlled task performance, engineering activity, software delivery and business outcomes.
| Level | Measures | Evidence |
| Perception | What developers believe changed | Median 3x self-reported speed (METR) |
| Controlled task | Completion under assignment | +26.08% (Microsoft); 19% slower (METR) |
| Engineering activity | Commits, PRs, throughput | Daily AI users ship 60% more PRs (DX); 43.2M PRs merged monthly, +23% YoY (Octoverse) |
| Delivery | Acceptance, throughput, stability | 32.7% AI PR acceptance vs 84.4% (LinearB); DORA stability negative in 2024 and 2025 |
| Business outcomes | Cost, ROI | 39% illustrative return (DORA); $28,249 estimated per developer (GitLab) |
Climbing the ladder trades experimental control for production realism: Level 2 gives clean causal attribution on assigned work, Level 4 measures what an organisation ships but cannot isolate AI, Level 5 rests on executive estimates. A claim at one level is not evidence for another.
Do Developers Overestimate AI Productivity Gains?
TechnBrains’ analysis found that developer perception diverged from observed workflow behavior in 3 of 4 dimensions examined, or 75%, including editing, code quality and context switching. The comparison uses paired survey and IDE telemetry data from 800 developers and 151.9 million events.
| Dimension | Telemetry | Perception | Match |
| Productivity | +600 typed chars/mo vs +75 | 80%+ report a gain | Aligned |
| Editing | +100 deletions/undos/mo vs +7 | Half report no change | Inverted |
| Code quality | No significant change | Almost half perceive gains | Diverged |
| Context switching | +6 IDE activations/mo vs -7 | Roughly half report no change | Diverged |
METR reinforces the perception gap: experienced developers believed AI made them 20% faster while measured task completion was 19% slower, a roughly 39-point perception-performance gap.
The combined evidence suggests developers recognize increased output more accurately than AI’s downstream effects on editing, workflow and measured task performance.
Does AI Improve Software Delivery Performance?
TechnBrains calculated a 51.7-percentage-point acceptance gap between AI-generated and manual pull requests: 32.7% versus 84.4%. Across 8.1M+ PRs, AI-assisted changes were also 2.6x larger and waited 4.6x longer for review.
Our review indicates that AI is expanding code-generation capacity faster than review and integration capacity. Because the underlying data is correlational, it does not establish AI as the cause of lower acceptance.
DORA’s longitudinal result is the most useful finding here. In 2024, a 25% rise in AI adoption was associated with 1.5% lower throughput and 7.2% lower stability, attributed partly to larger change batches.
How Do AI-Generated Pull Requests Perform in Code Review?
| Metric | AI-assisted | Human |
| PR size | 408 lines | 157 lines |
| Review pickup wait | 4.6x longer | Baseline |
| Agentic PR idle time | 1,055 minutes | 201 minutes |
| Acceptance rate | 32.7% | 84.4% |

Two cautions: LinearB is a commercial platform using its own AI classification, and the data is correlational, since larger pull requests wait longer regardless of authorship. The finding is not that AI causes rejection, but that generation volume does not translate into merged output.
How Much Time Do Developers Save with AI?
Developers report saving 3.9 hours per week with AI, but some of that gain appears to shift into verification and review. Developer toil remains close to 24% of the work week, and 38% say AI-generated code requires more review effort than a colleague’s code.
This downstream effort is what DORA describes as the verification tax. A synthetic-control study of Copilot adoption agrees: 6.5% higher project productivity alongside 41.6% longer integration time.
How Many Developers Use AI Coding Agents in 2026?
64% of professional developers already using AI have started using autonomous coding agents. Across the broader developer population, adoption is lower: 38% had no plans to use agents in Stack Overflow’s 2025 survey, while its 2026 pulse reported usage had doubled from a 31% baseline.
GitHub’s Copilot coding agent authored 1 million pull requests between May and September 2025. Yet only 17% of Stack Overflow’s agent users said agents improved team collaboration, the lowest-rated impact, and LinearB found agentic pull requests idling 5.3x longer before review.
How Should AI Coding Agent Productivity Be Measured?
We recommend measuring agent task success, human intervention, review latency and accepted output rather than hours saved alone.
Concurrent agents can work asynchronously while developers perform other tasks, making elapsed time increasingly unreliable as a standalone productivity metric.
Do Developers Trust AI-Generated Code?
We saw a 13-percentage-point trust deficit in Stack Overflow’s developer data: 33% trust AI accuracy while 46% distrust it.
Separate verification data shows the problem extends beyond sentiment: 54% question AI code’s functional correctness, yet only 48% always verify AI-generated code before committing.
Developers treat AI as a draft: their most common frustration, at 66%, is code that is almost right rather than obviously broken. A further 35% use personal rather than sanctioned accounts, outside whatever policy their employer believes it has.
How Secure Is AI-Generated Code in 2026?
TechnBrains calculated a 40–50-percentage-point gap between AI code’s syntax and security pass rates in 2026: roughly 95% for syntax versus 45–55% for security.
Controlled testing also produced detectable OWASP Top 10 vulnerabilities in 45% of AI coding tasks without security-specific prompting.
The evidence suggests model capability has improved much faster at producing valid code than secure code.
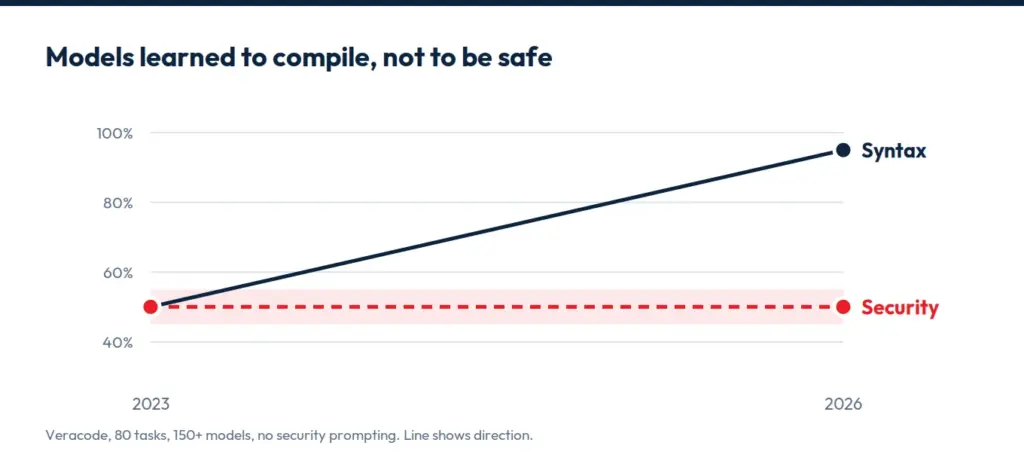
Veracode’s Spring 2026 update across 150+ models found syntax pass rates climbing from roughly 50% to 95% since 2023 while security pass rates stayed flat between 45% and 55%, regardless of model generation or size.
Syntactic correctness and secure implementation are different capabilities, and only one improved, so waiting for the next model generation to fix AI code security is not supported by the trend.
Does AI Improve Code Quality or Create Technical Debt?
93% of developers report at least one positive technical-debt effect from AI, while 88% report at least one negative effect.
GitHub’s vendor-funded study of 202 developers found Copilot users 53.2% more likely to pass all ten unit tests; independent work found no quality change.
GitClear, a commercial analytics vendor, tracks maintainability across 600M+ commits and reports refactoring line moves down 70% against 2022 and cross-file reuse down 35%. These are maintainability signals, not defect counts. They describe a workflow rewarded for closing a ticket while deferring the consolidation work that decides what a codebase costs to own later, which is why AI hallucinations in coding matter most at review.
Do Junior or Senior Developers Benefit More from AI?
There is no universal winner. Juniors adopt fastest, at 41.3% daily usage in DX’s data, and report the largest gains, at 40% in Sonar’s. Staff-plus engineers report the largest time savings at 4.4 hours per week, while experienced developers are the most sceptical. Sonar adds a complication: juniors report the highest gains and are likelier than seniors to say reviewing AI code takes more effort.
Will AI Replace Software Developers? 2026 Employment Data
The occupational and cohort signals point in different directions. The US Bureau of Labor Statistics projects 15% growth for software developer roles to 2034. Stanford’s Digital Economy Lab, using ADP payroll records, found roughly a 6% relative employment decline among 22 to 25-year-olds in the most AI-exposed occupations from late 2022 to September 2025, while experienced workers stayed resilient.
HackerRank’s 2024 hiring activity rose 22% for leads against 7% for entry level, though it does not attribute the gap to AI.
At the role level, the evidence describes changing task composition, not replacement: GitLab found 76% agreeing easier coding could lead to more engineers, while 83% expected their role to change significantly. The cohort signal is real; the causal attribution is not.
What Is the ROI of AI Coding Tools in 2026?
We found no audited universal AI coding-tool ROI benchmark in the evidence reviewed. DORA’s ROI report provides a framework; its illustrative 500-person scenario models a 39% return with roughly eight-month payback, a modelled example, not a measured outcome.
GitLab’s 2,786 C-level executives estimated $28,249 saved per developer per year, documenting belief rather than audited return.
DORA’s J-Curve is the more useful contribution: an initial productivity dip framed as a tuition cost to budget. If leadership expects immediate returns and metrics dip at three to six months, funding gets cut exactly where the curve would have turned.
Which AI Software Development Metrics Should Engineering Teams Track?
You must track AI-authored merged code, PR acceptance and review latency, PR size and rework, defects and security outcomes, and agent success and human-intervention rates.
| Measure | Why |
| AI-authored merged code | The only output figure measured after human filtering |
| PR acceptance rate and review pickup time, by author type | The sharpest waste signal, and where the bottleneck sits |
| PR size and rework rate | Batch size drives review delay; rework is where the verification tax lands |
| Defect and security findings on AI changes; cycle time and change failure rate | Model security capability has been flat since 2023, and DORA stability stayed negative through 2025 |
| Agent task success and intervention rate | Elapsed time is incomplete for agentic work |
Instrument acceptance rate first: it is the cheapest measure separating output from delivered work. DX found organisations with structured enablement see 8% better maintainability and 19% less time loss, which makes AI code review tools a design decision, not a purchase.
Conclusion
Access to AI is now the baseline condition of software development, and the 74% to 97% range will keep narrowing upward without saying much about engineering outcomes.
The advantage sits in four decisions: where to delegate, given that assistance is mature and autonomous production ownership is not yet visible at scale; where to verify, given that model security capability has been flat since 2023 while syntax capability nearly doubled; how to measure, given that elapsed time is incomplete under agentic workflows; and where human judgement is still the constraint, which the data locates at review, integration, security and architecture.
If your team generates code faster than it can review, verify and ship it, that is an engineering system problem, not a tooling problem. TechnBrains helps engineering leaders close that gap, from review and delivery capacity to senior engineers who absorb the verification load.
Table of Contents
Frequently Asked Questions
Definitions differ, which is why the figures do. DX counts only AI-generated code merged without major human rewrites, giving 22% rising to 27.4%. Sonar's wider "generated or significantly assisted" measure of committed code gives 42%.
The gap is the distance between distrust and checking: Sonar found 96% do not fully trust AI code, while only 48% always verify before committing. DORA's verification tax is the resulting effort, and it is why Sonar's toil measure held near 24% of the work week regardless of AI usage.
DX respondents self-report 3.9 hours per week, a figure DX says has plateaued as usage outpaces integration. Whether that time is retained downstream is a separate question.
Delegating a task to AI from intent to implementation with little review of intermediate steps. Stack Overflow's 2025 survey found 72% of developers not doing it.
A modelled pattern where AI adoption produces an initial productivity dip before returns appear. DORA frames the dip as a tuition cost to budget, not a failure.
Sonar's respondents forecast 65% of committed code. That is a prediction, not an observation, and should not be cited as a current figure.
No, on the only telemetry that has tested it. JetBrains found AI users increasing IDE activations by roughly 6 per month over two years while non-users decreased by 7.
Bring the Idea. We’ll Own the Engineering.
TechnBrains turns product requirements into scalable software, from the first architecture decision through production release.